How is Barrow Offshore WInd Farm performing?
9 September 2021
Barrow Offshore Wind Farm
Barrow Offshore Wind Farm is a 30 turbine 90MW capacity offshore wind farm in the Irish Sea.
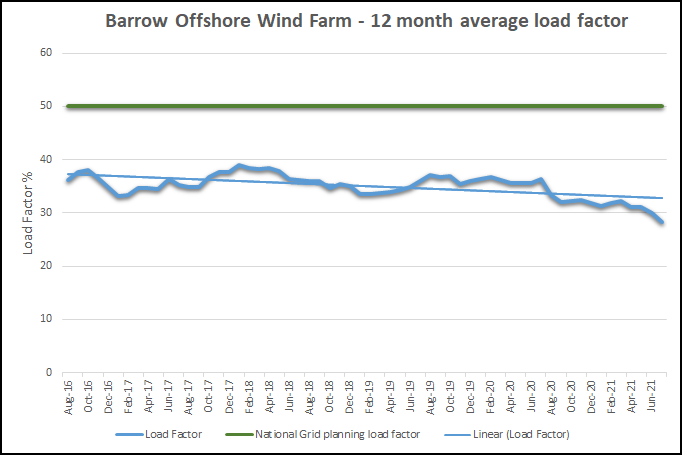
The following chart shows the 12 month rolling average load factor over the last 5 years.

We have plotted the 12 month rolling average load factor from August 2016. The use of the 12 month rolling average largely eliminates distractions due to seasonal factors.
The data are the official National Grid figures as supplied by the Elexon website.
The green horizontal line shows the load factor that the National Grid uses currently as its default for planning purposes. The load factor for onshore wind farms is about 40%, and for offshore it's about 50%. The National Grid's long term approach is to assume that this factor is maintained into the future, although it is updated from time to time based on past performance and the characteristics of new turbines.
Note that the load factor is generally decreasing as the wind farm ages. This is a common feature of wind farms performance. As you can see Barrow's performance is always well below the horizontal green line. You can also see that the performance is deteriorating, the narrow line showing the line of best fit to the 5 years of data.
How much energy will Barrow be producing when it is 25 years old in 2031?
Having illustrated deterioration with another wind farm, we'll publish some more of these charts in the near future.