>What does intermittency look like? Can wind deliver in the longer term?
27 August 2021
Greater Gaabbard 1
Greater Gabbard is a 504 MW wind farm off the coast of Suffolk in England. It comprises three components: Greater Gabbard 1, 2 and 3. It was completed in 2012 and first supplied electricity to the National Grid in August of that year.
The following chart shows the daily energy produced by Greater Gabbard 1. The chart is explained below.
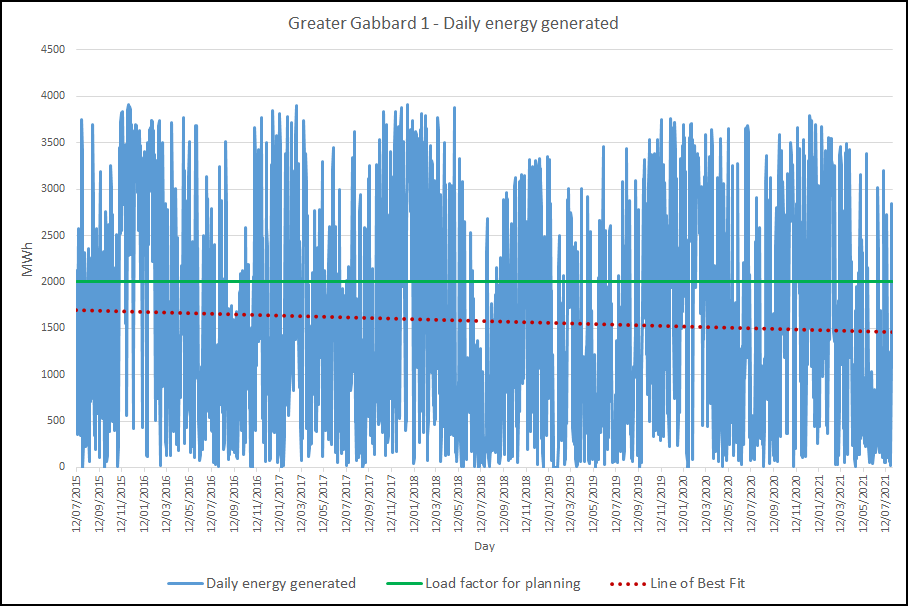
We have used 12 July 2015 as the start date of our analysis. This is the first date on which Greater Gabbard 1 generated at least 2000MWh, the daily energy that would be produced if the wind farm were operating at the National Grid's "planning" load factor (see below). The chart currently runs until 31 July 2021.
The data are the official National Grid figures as supplied by the Elexon website.
Note the extremely wide variations in energy generated from day to day, and how much it fluctuates. Occasionally high values are achieved, but 0 happens as well. In fact, when a value of 0 is shown it usually corresponds to a day where the wind farm is taking energy from the grid, as each wind farm needs power from somewhere to operate.
The green horizontal line shows the amount of energy that corresponds to the load factor that the National Grid uses currently as its default for planning purposes. The load factor for onshore wind farms is about 40%, and for offshore it's about 50%. The National Grid's long term approach is to assume that this factor is maintained into the future, although it is updated from time to time based on past performance and the characteristics of new turbines.
The dotted line is the line of best fit for daily energy produced by Greater Gabbard 1 from the start date to the end date. As you can see it is always below the horizontal green line. (If we had used early readings from Greater Gabbard 1 they would have significantly reduced the "average" energy produced as in the early days generation was much lower and spasmodic. It usually takes some time for the performance of a wind farm to "settle down".)
Perhaps the most worrying aspect of the dotted line is that it confirms that average performance has been declining since Greater Gabbard 1 first achieved "standard performance", which for a 167MW wind farm and a 50% load factor is 2000MWh per day. Its average load factor in July 2015 was almost 40%, but by July 2021 this had dropped to about 32.4%.
How much energy will Greater Gabbard 1 be producing when it is 25 years old in 2037?
Having illustrated intermittency and deterioration with one wind farm, we'll publish some more of these charts in the near future.