Ofshore wind can do it all by 2030 ... Hmmm
12 October 2020
You may have seen this news item on 6 October 2020. Boris Johnson has pledged that offshore wind farms will generate enough electricity to power every home in the UK within a decade.
Can that work? Let's try it out with an example.
We'll start by assuming that the Prime Minister means GB supplies, as electricity in Nothern Ireland is supplied as part of the Irish grid.
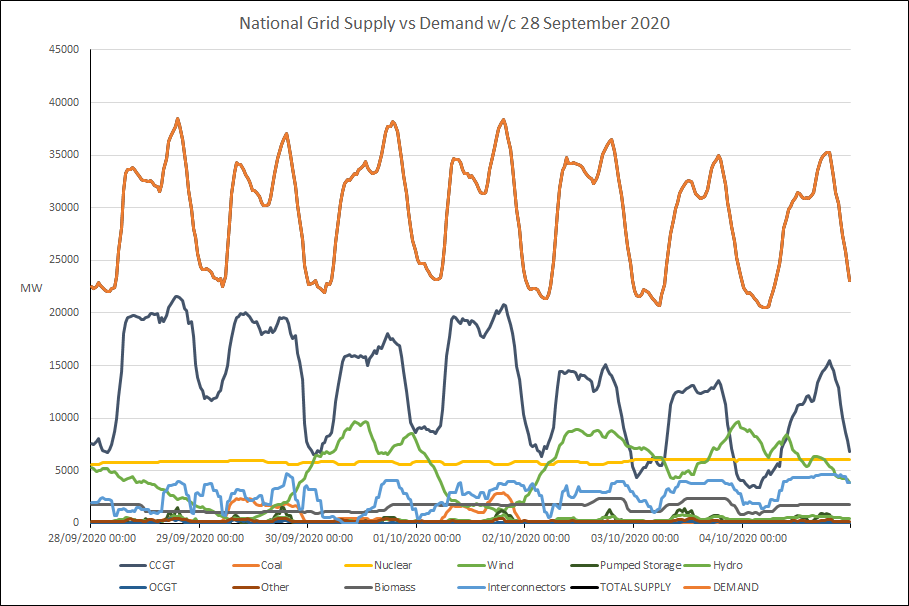
Week commencing 28 September 2020 was fairly unremarkable from the point of view of wind. This is how it looked from the point of view of supply and demand. The red line at the top shows demand, wind is shown in green and CCGT Gas is in blue.
Let's project last week's wind pattern forward to 2030 and see how the revised supply resources would cope.
The week now starts on Monday 30 Sep 2030. We'll use the Leading the Way scenario, details of which you find in the FES 2020 documents. Let's make some of the major changes.
According to FES 2020 demand will have increased from about 302 TWh to about 309 TWh (not including Interconnector exports and a few other items), so we'll scale the demand for the week accordingly.
We won't be using coal or CCGT any longer, so we'll remove those from the available supply. The black line shows the total supply at this stage.
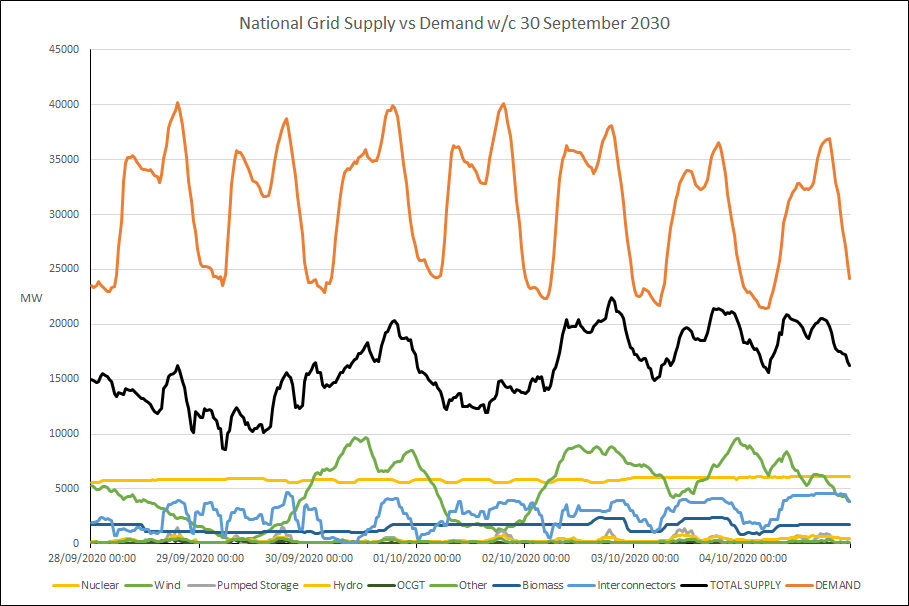
There are other reductions in supply to make. Leading the Way says that Nuclear capacity and generation will have decreased by about half. Generation from Biomass will have reduced to less than 10% of its 2020 value. There will be no OCGT.
As you can see, it appears that total supply will now fall well short of demand. However, several supplies will have increased.
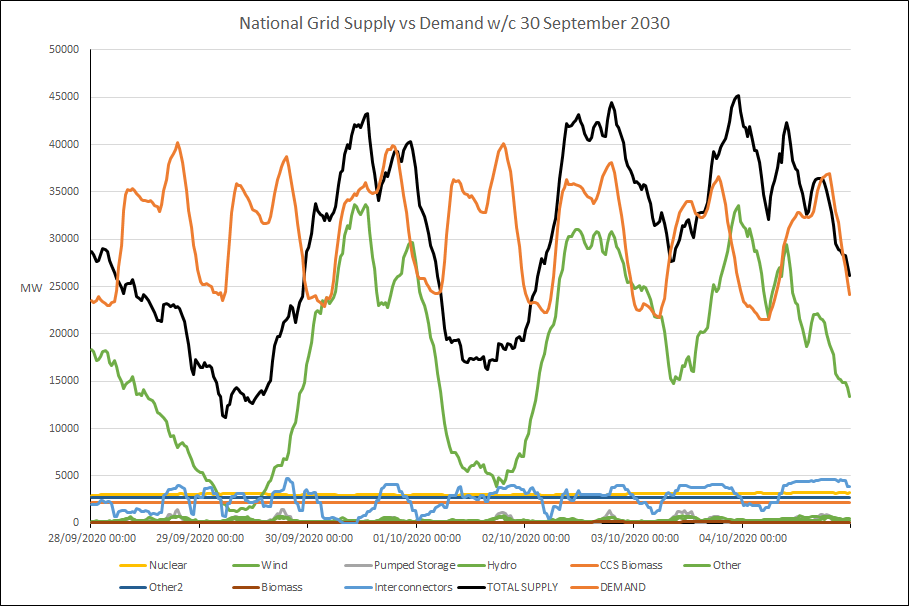
Generation from "Other" sources will have increased by about a half.
CCS Biomass will have been introduced, with a capacity of 3,600 MW and a projected load factor of about 60%. We've added that as a supply.
We also see increases in supply for some of the minor sources, notably Solar PV, Marine and Waste. We've added an "Other 2" contribution for those increases.
Now for Wind. We've used the increases in capacity projected in Leading the Way, including a capacity of over 40 GW for offshore wind.
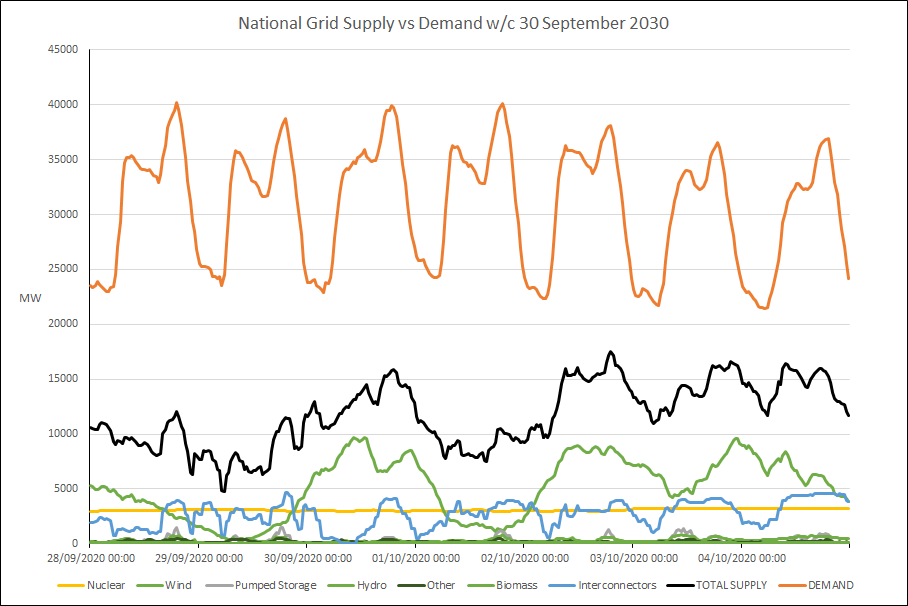
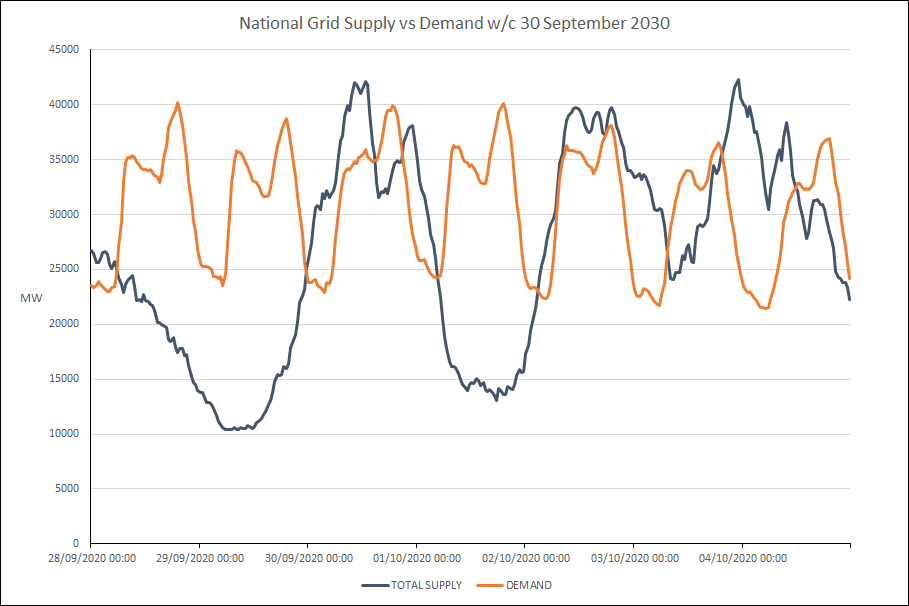
Supply vs Demand now looks like this.
As you can see, our revised set of supply sources can now meet demand for several periods of time during the week (i.e. black is above red), but there are substantial and prolonged deficits.
For these deficits to be resolved we'll need to use the last two major options available to us: Interconnectors and Storage.
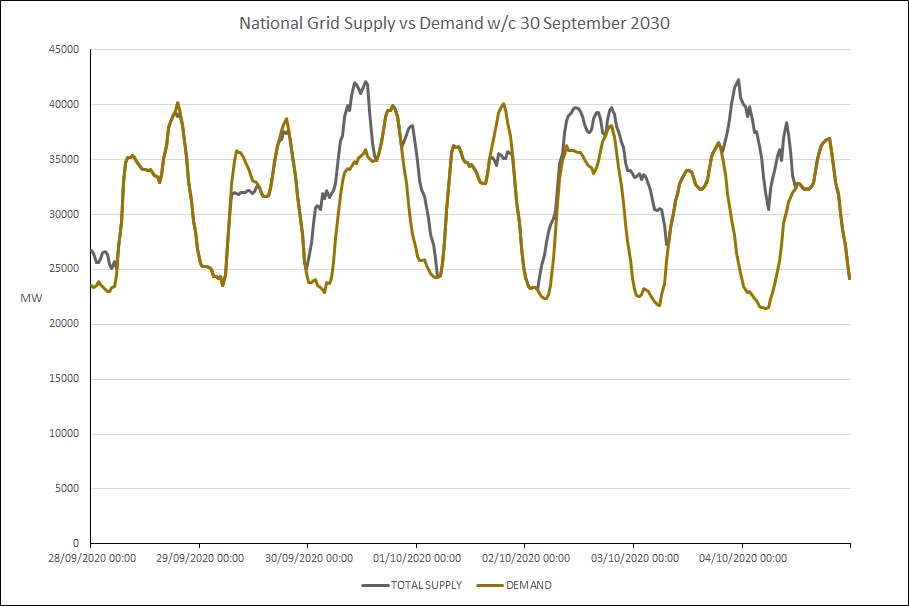
Let's start by removing the existing contributions from Interconnectors and Storage to see clearly what the "starting points" are for using these two resources.
We'll also "hide" the other individual sources (they're still included in the total supply, you just don't see them in the chart now) and just show demand and total supply so far.
Let's look first at what might be achieved with supplies via Interconnector. In Leading the Way the capacity for Interconnectors is 21,450 MW. Using this as a maximum supply vs demand now looks like this.
It appears that all but a few deficits can be eliminated, but there are some major problems with this.
- Using Interconnector supplies would mean that we are not supplying all GB households using Offshore Wind. Did the Prime Minister mean to exclude Interconnector supplies? Another aspect of Interconnectors is that these supplies at present include substantial amounts generated from fossil fuels. We do not know what proportion of the sources will be fossil fuel based in 2030. So, this option hardly qualifies us to claim that all electricity used in GB homes is from Offshore Wind.
- Leading the Way projects exports via Interconnector of twice the volume of imports in 2030, i.e. over the year there will be a substantial outflow from GB. We could not assume that for any regular week - such as this one - we can just "switch on" the maximum amount of Interconnector capacity at will.
- In fact, the projection in Leading the Way is that we will be exporting twice as much as we import. The volume of exports projected is not included in the demand figure in the chart, but if it were it would be equivalent to an additional continuous average demand of almost 8,500 MW, although the actual export "demand" figure could be as much as 21,450 MW.
- Although the Capacity Market specifies bounds for the availability of power via Interconnectors, it does not guarantee that imports will be available at any moment in time. If such requirements existed within the agreements involved, GB would need to export on demand as well, which in a week like this one would severely threaten our own ability to "keep the lights on", given that we would be in deficit for more than half of the week.
The second option is the use of Storage.
The Leading the Way projection for Storage capacity is a maximum power available of just under 14,000 MW. However, the total stored energy would be less than 110 GWh. This means that the available stored energy - even if storage were fully charged at the start of a period of deficit - would last less than 8 hours. The low power available and the limited storage capacity means that storage would have a very limited ability to address the deficits.
In order to have enough stored energy we would need almost 700 GWh of stored energy, and to claim that GB domestic supply is being provided by Offshore Wind this would all need to be supplied by Offshore Wind. Given the much longer term plans for electrolysis and hydrogen generation and storage, this could eventually be feasible, but it is certainly not scheduled to be there by 2030.
And don't forget, the week we have been looking at is a fairly unremarkable one. There have been other recent weeks that would cause much worse problems.
Conclusion
Even with the most optimistic approach a typical "weather and wind" week of the kind GB has been experiencing lately will cause major problems for electricity supply without fossil fuel support.
As it stands at the moment, the Prime Minister's target will not be met without frequent, lengthy power shortages.
Data sources
You can reproduce our calculations using data from a couple of sources.
To get the data on supply and demand for w/c 28 September 2020, use the Elexon website.
For details of the National Grid forecast and scenarios see the FES 2020 documents.
Why not try to do the same calculation using one of the other National Grid FES 2020 scenarios?