FES 2024 and its significant flaws
The National Energy System Operator (formerly the Electricity System Operator for Great Britain) publishes its Future Energy Scenarios (FES) every year. The latest version, FES2024, uses various pathways to model supply and demand up to 2050. (These replace the scenarios used in previous FES versions.)
All scenarios have similar features including:
- Most generation capacity to 2050 will be in wind turbines whose output is extremely variable in nature
- The virtual elimination of gas, which is currently the primary controllable source used to counter this variability
- A massive increase in interconnector capacity, leading to reliance on other countries being willing to maintain supplies to the UK when they also may be experiencing power shortages
- The use of storage to bridge gaps in generation.
However, the duration and frequency of wind lulls in the UK mean that the reliance on wind as the principal energy source, without some form of controllable back up, will lead to an increase in the incidence of blackouts.
Generating Capacity
Table ES1 in FES2024 gives details of the way in which demand will be met in each pathway. Taking “Holistic Transition” as an example, it predicts that demand will increase from 286TWh in 2022 to 667TWh in 2050, or 2.33 times.
To meet this increased demand, generating capacity must be increased as shown in ES1.
| Type | 2023 (MW) | % of generating capacity | 2050 (MW) | % of generating capacity | Change |
| | | | | | |
| Nuclear * | 6075 | 9.1 | 14010 | 7.4 | 2.3x |
| Offshore Wind | 14035 | 20.9 | 99732 | 52.6 | 7.1x |
| Onshore Wind | 7959 | 11.9 | 21782 | 11.5 | 2.7x |
| Solar | 60 | 0.1 | 24584 | 13.0 | 411x |
| Hydro & Marine | 1363 | 2.0 | 4248 | 2.2 | 3.1x |
| Hydrogen | 0 | 0 | 12097 | 6.4 | - |
| Biomass ** | 3508 | 5.3 | 3400 | 1.5 | 1.0x |
| Gas ** | 31513 | 47.1 | 9670 | 5.1 | 0.3x |
| Coal | 1988 | 3.0 | 0 | 0 | - |
| Other | 554 | 0.1 | 40 | 0 | - |
| | | | | | |
| Total Generating Capacity | 67055 | | 189563 | | 3.0x |
* Nuclear includes small modular reactors in 2050
** Gas is CCS Gas and Biomass is CCS Biomass in 2050
Whereas the grid currently relies significantly on gas and coal, which contribute over 50% of generating capacity, by 2050 the majority dependence will be on offshore and onshore wind, which represent over 64% of generating capacity, with solar contributing a further 13%.
Comparison with FES2023
In FES2023, the scenario similar to Holistic Transition is “Leading the Way”. This predicted demand of 507TWh in 2050. So the demand now being predicted is over 30% more than was predicted last year.
So how has generating capacity in 2050 increased in FES 2024?
| Type | FES2023 (MW) | % of generating capacity | FES2024 (MW) | % of generating capacity | Change |
| | | | | | |
| Nuclear | 9790 | 6.6 | 14010 | 7.4 | 1.4x |
| Offshore Wind | 96052 | 64.4 | 99732 | 52.6 | 1.0x |
| Onshore Wind | 23341 | 15.7 | 21782 | 11.5 | 0.9x |
| Solar | 6751 | 4.5 | 24584 | 13.0 | 3.6x |
| Hydro & Marine | 2116 | 1.4 | 4248 | 2.2 | 2.2x |
| Hydrogen | 5500 | 3.7 | 12097 | 6.4 | 2.2x |
| Biomass | 2200 | 1.5 | 3400 | 1.5 | 1.5x |
| Gas | 3310 | 2.2 | 9670 | 5.1 | 2.9x |
| Coal | 0 | 0 | 0 | 0 | - |
| Other | 0 | 0 | 40 | 0 | - |
| | | | | | |
| Total Generating Capacity | 149060 | | 189563 | | 1.3x |
So generating capacity has increased in line with the predicted increase in demand.
Back Up
Table ES1 of FES2024 also details proposals for non-generation.
| Type | 2023 (MW) | % of total capacity | 2050 (MW) | % of total capacity | Increase |
| Interconnectors | 8400 | 9.3 | 25050 | 12.3 | 3.6x |
| Pumped Hydro | 2744 | 3.1 | 6800 | 2.9 | 2.5x |
| Battery | 1734 | 1.1 | 18347 | 12.0 | 30x |
| Compressed Air | 0 | 2.0 | 4000 | 4.2 | 2.1x |
| Liquid Air | 0 | | 3750 | | |
| | | | | | |
| Total Capacity | 12878 | | 57947 | | 4.5x |
The main back up by 2050 will be interconnectors, mainly from mainland Europe, and various forms of storage, notably battery. Interconnectors are reliant on power being made available from suppliers. Storage, including pumped hydro, is reliant on power being available for charging.
Comparison with FES2023
Again using “Leading the Way” from FES2023, a comparison of back up predictions can be made.
| Type | FES2023 (MW) | % of total capacity | FES2024 (MW) | % of total capacity | Increase |
| Interconnectors | 26750 | 12.3 | 25050 | 12.3 | 0.94x |
| Pumped Hydro | 6200 | 2.9 | 6800 | 2.9 | 1.10x |
| Battery | 16341 | 7.5 | 18347 | 12.0 | 1.12x |
| Compressed Air | 6000 | 2.8 | 4000 | 4.2 | 0.67x |
| Liquid Air | 3750 | 1.7 | 3750 | | 1.0x |
| DSR* | 9019 | 4.2 | - | | |
| | | | | | |
| Total Capacity | 68060 | | 57947 | | 0.98x** |
*Demand side reduction, which is no longer mentioned, is reliant on being able to restrict supply without significant effect on industrial, commercial or domestic activities. FES2024 does however mention curtailment.
**The comparative total excludes DSR.
Solar and Wind
It is not possible to produce any realistic comparison for solar generation between 2023 and 2050 as there is so little solar connected to the Grid at present. However, it is self-evident that solar works during daylight hours and that these are reduced during the winter months when demand is higher and, in particular, there may be little generation at peak times.
It is possible to extrapolate from 2023 to 2050 for wind generation as there is already a fleet of onshore and offshore wind turbines. It is now recognised that wind turbine output is very variable and can make a significant contribution to demand when the wind blows strongly but little when there is little wind.
These periods of low wind have previously been acknowledged in FES2023, with pages 211–218 covering “Dunkelflaute”. The document says “‘Dunkelflaute’, refers to a period of cold weather with low light and little to no wind across Northern Europe. In this analysis they will be referred to as wind lulls.
Wind contribution to Demand
Using the latest data available from the National Grid Electricity Supply Organisation (ESO) shows that wind makes a significant contribution to demand on average. But averages are not meaningful if we are to be reliant on wind as our major source of generation by 2050.
The table below shows average, minimum and maximum contributions for the main sources of electricity during the first half of 2024.
| | Gas (CCGT) (%) | Wind (%) | Interconnectors (%) |
| | Ave | Min | Max | Ave | Min | Max | Ave | Min | Max |
| Jan | 36.1 | 6.8 | 66.5 | 30.3 | 7.2 | 63.3 | 12.1 | - | 31.3 |
| Feb | 27.5 | 6.5 | 55.3 | 31.1 | 0.6 | 62.9 | 17.2 | 0.2 | 33.8 |
| Mar | 25.8 | 7.4 | 54.5 | 29.5 | 4.5 | 63.3 | 21.4 | 1.4 | 36.8 |
| Apr | 18.8 | 2.8 | 50.2 | 32.9 | 2.7 | 63.3 | 17.8 | - | 33.5 |
| May | 28.0 | 6.3 | 51.0 | 17.4 | 0.8 | 56.5 | 24.3 | 10.0 | 39.8 |
| Jun | 23.0 | 4.9 | 48.8 | 23.1 | 3.4 | 59.5 | 24.5 | - | 44.0 |
Note: exports via interconnectors not shown
Maximum contributions from wind are often quoted by advocates of wind turbines, particularly when that contribution exceeds that of gas. Average contributions from wind have exceeded those from gas in four out of six months in the first half of 2024 and again this may be used to promote the benefits of wind.
However, it is critical to look at minimum contributions. In two out of six months the minimum contribution from wind was below 1%. In three further months in was less than 5%, and in January less than 10%. The variation in gas is because it is being controlled to meet demand as other contributions vary.
Contributions from interconnectors have risen generally over the period both in terms of average and also maxima. This implies that the UK is becoming more reliant on imports.
Wind Lulls
As stated earlier, wind lulls are now acknowledged and are confirmed in the table above. Taking a wind lull as when wind contributes less than 10% of demand, a more detailed analysis of the data for the first half of 2024 shows just how frequent and often prolonged these wind lulls can be.
The table below shows periods where wind has contributed less than 10% of demand in 2024 to date.
| Month | Total Hours <10% | No. of Lulls | No. of Lulls >5 hours | No. of Lulls >10 hours | Maximum Lull (hours) |
| January | 22 | 5 | 2 | 0 | 7 |
| February | 92 | 6 | 5 | 3 | 38 |
| March | 90.5 | 11 | 7 | 2 | 29 |
| April | 57.5 | 4 | 3 | 2 | 23.5 |
| May | 264 | 12 | 8 | 6 | 93 |
| June | 98.5 | 10 | 6 | 4 | 31.5 |
| TOTAL | 625.5 | 48 | 31 | 17 | |
| cf 2023 | 617 | 69 | 40 | 21 | 55.5 |
| | | | | | |
The table confirms not only that low wind speeds occur, but that they are frequent and often extended. It also indicates overall that weather patterns have remained the same as the previous year.
Of particular concern is the extended wind lull of 93 hours, almost 4 days, experienced in May. The shortfall was met be gas and interconnectors.
In FES 2024 there is no reference to the figures having been tested against wind performance for recent years at the half-hour level, which is how the above figures were derived (1). If they were they would show that the storage/back up proposed would be totally inadequate.
A graph for May shows how other sources, primarily gas and interconnectors, made up the shortfall in supply from wind turbines particularly at times of peak demand.
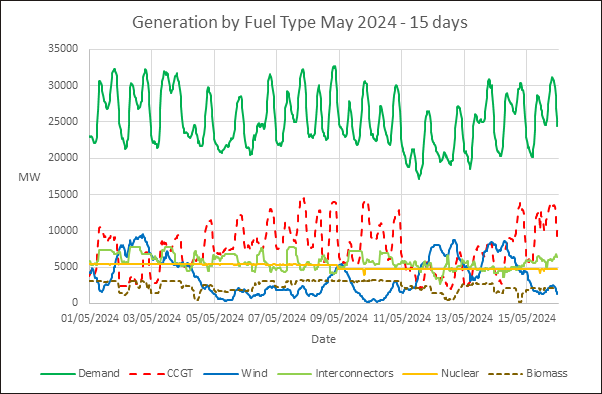
Only the first 15 days are shown for clarity. The variation in the contribution of wind to grid demand is illustrated by the minimum contribution of 229MW on 10 May and a maximum of 8709MW on 12 May. It can also be seen that gas (CCGT) is being called upon to meet peak demand almost every day, with imports via interconnectors also being used to meet peak demand.
Note: the maximum contribution from wind in May was 14108MW on 24 May, a variation in output of over sixty times during the month.
Extended periods of little wind
Looking at the table again, the total number of hours when wind contributed less than 10% of demand is 625.5 hours, or over 26 days and the longest single period is 93 hours, or almost 4 days. This pattern is similar to that observed over recent years despite a substantial increase in installed wind turbine capacity over that period. Assuming weather patterns remain the same in the future, it can be assumed that wind lulls will not significantly decrease as the capacity of operational wind turbines is increased.
Projections to 2050
Taking May 2024 as an example and simply multiplying the actual data from the 2024 shows that total demand would be 43312 GWh and supply would be 42392 GWh, or 97.9%. Wind would be the major contributor at 40.8% with interconnectors at 30.6% and Nuclear at 19.3%. (Note: it has not been possible to model the contributions from Hydrogen and Solar as there is little or no contribution to the grid at present and their contribution is excluded from the above supply figure.)
But this is an average. Looking at the first 15 days of May and increasing demand and capacity in the Holistic Transition pathway given in Table ES1 of FES2024 gives the following graph.
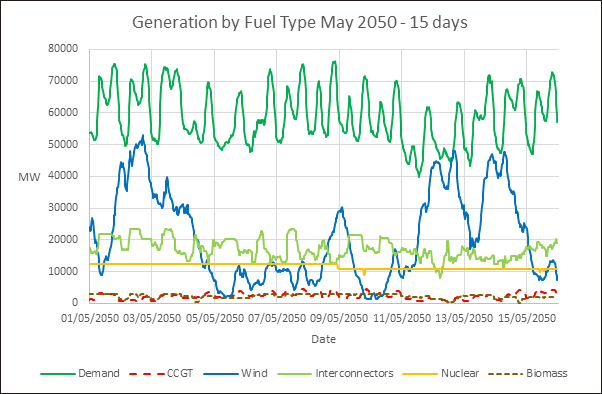
Total demand over this period would be 21174 GWh and supply would be 19617 GWh, or 92.6%. Wind would again be the major contributor at 35.7% with interconnectors at 29.2% and nuclear at 19.8%. Could the shortfall of 1557 GWh be made up from hydrogen and solar?
Looking in more detail, the 6-day period from 5 to 10 May gives the following. Total demand would be 8488 GWh and supply would be 6414 GWh, or 75.6%. The major contributor now is interconnectors at 29.6% followed by nuclear at 20.1% with wind only contributing 16.5%. It would appear to be clear that the shortfall of 2074 GWh, almost 25% of demand, could not be made up by hydrogen and solar.
The Holistic Transition pathway states “Supply side flexibility is high, delivered through electricity storage and interconnectors”. In other words when the wind does not blow storage and interconnectors will meet demand.
However, ‘Dunkelflaute’ refers to a period of little to no wind across Northern Europe. The imports from Europe are critical as detailed above, providing 30% of demand over extended periods. But are they going to be available during a period of ‘Dunkelfalute’ which may affect the European suppliers as well as the UK?
This leaves storage to fill the gap. Table ED1 which provides all the statistics behind FES2024 gives a total storage capacity over a year as 13700 GWh. This equates to 1142 GWh per month or 225 GWh over 6 days. This 225 GWh compares with the estimated shortfall in generation of 2074 GWh over 6 days in May 2050, about 11% of the requirement. Over such long periods of low wind, that storage could not be topped up and there would be insufficient to cope with the lack of wind power.
The Solution
It is suggested that the National Grid should look to more reliable and predictable sources of renewable energy rather than rely on wind as its principal supply of power to the Grid. Taking the predictions for May 2050 as an example indicates that the pursuit of such a policy will result in extended periods when demand cannot be met and hence there will be prolonged blackouts.